When I asked people on Facebook whether Google Analytics made them feel lost and confused, their answers shocked me:

“[Google Analytics] makes me feel stupid,” said one website owner.
“Using [Google Analytics is] like [being] in one of those scary cornfield [labyrinths],” said another.
As a blogger since 2008, I know Google Analytics for beginners can be daunting, but I never knew how strongly people felt this pain.
If you feel the same way, take heart; you’re not alone.
And you mustn’t give up on Google Analytics!
It gives you powerful data that can help you become a much smarter blogger and website owner—data you can use to make informed decisions instead of guesses.
But with power comes complexity.
I’ve been using Google Analytics for years and I still feel lost sometimes.
The good news is, you only need a few basic pieces of information to glean plenty of insights about how to get better results from your blog/website.
Google Analytics Training (Video)
Watch these videos to see what basic website metrics you need and how to interpret them using the WordPress plugin, Analytify:

"With power comes complexity, so don't give up on Google Analytics"
Note: You’re seeing my actual Google Analytics data and, I have to admit, it's kind of embarrassing for me to do that because I've been neglecting it, so bear with me.
What you're looking at in the video is my WordPress dashboard. I use the Analytify plugin so that my Google Analytics stats are viewable right on my WordPress dashboard. That removes the step of having to log into Google Analytics.
Because I'm still admin for some clients, my Google Analytics login looks cluttered, so it’s great that I don’t need to leave my WordPress dashboard at all.
Traffic Metrics from Google Analytics
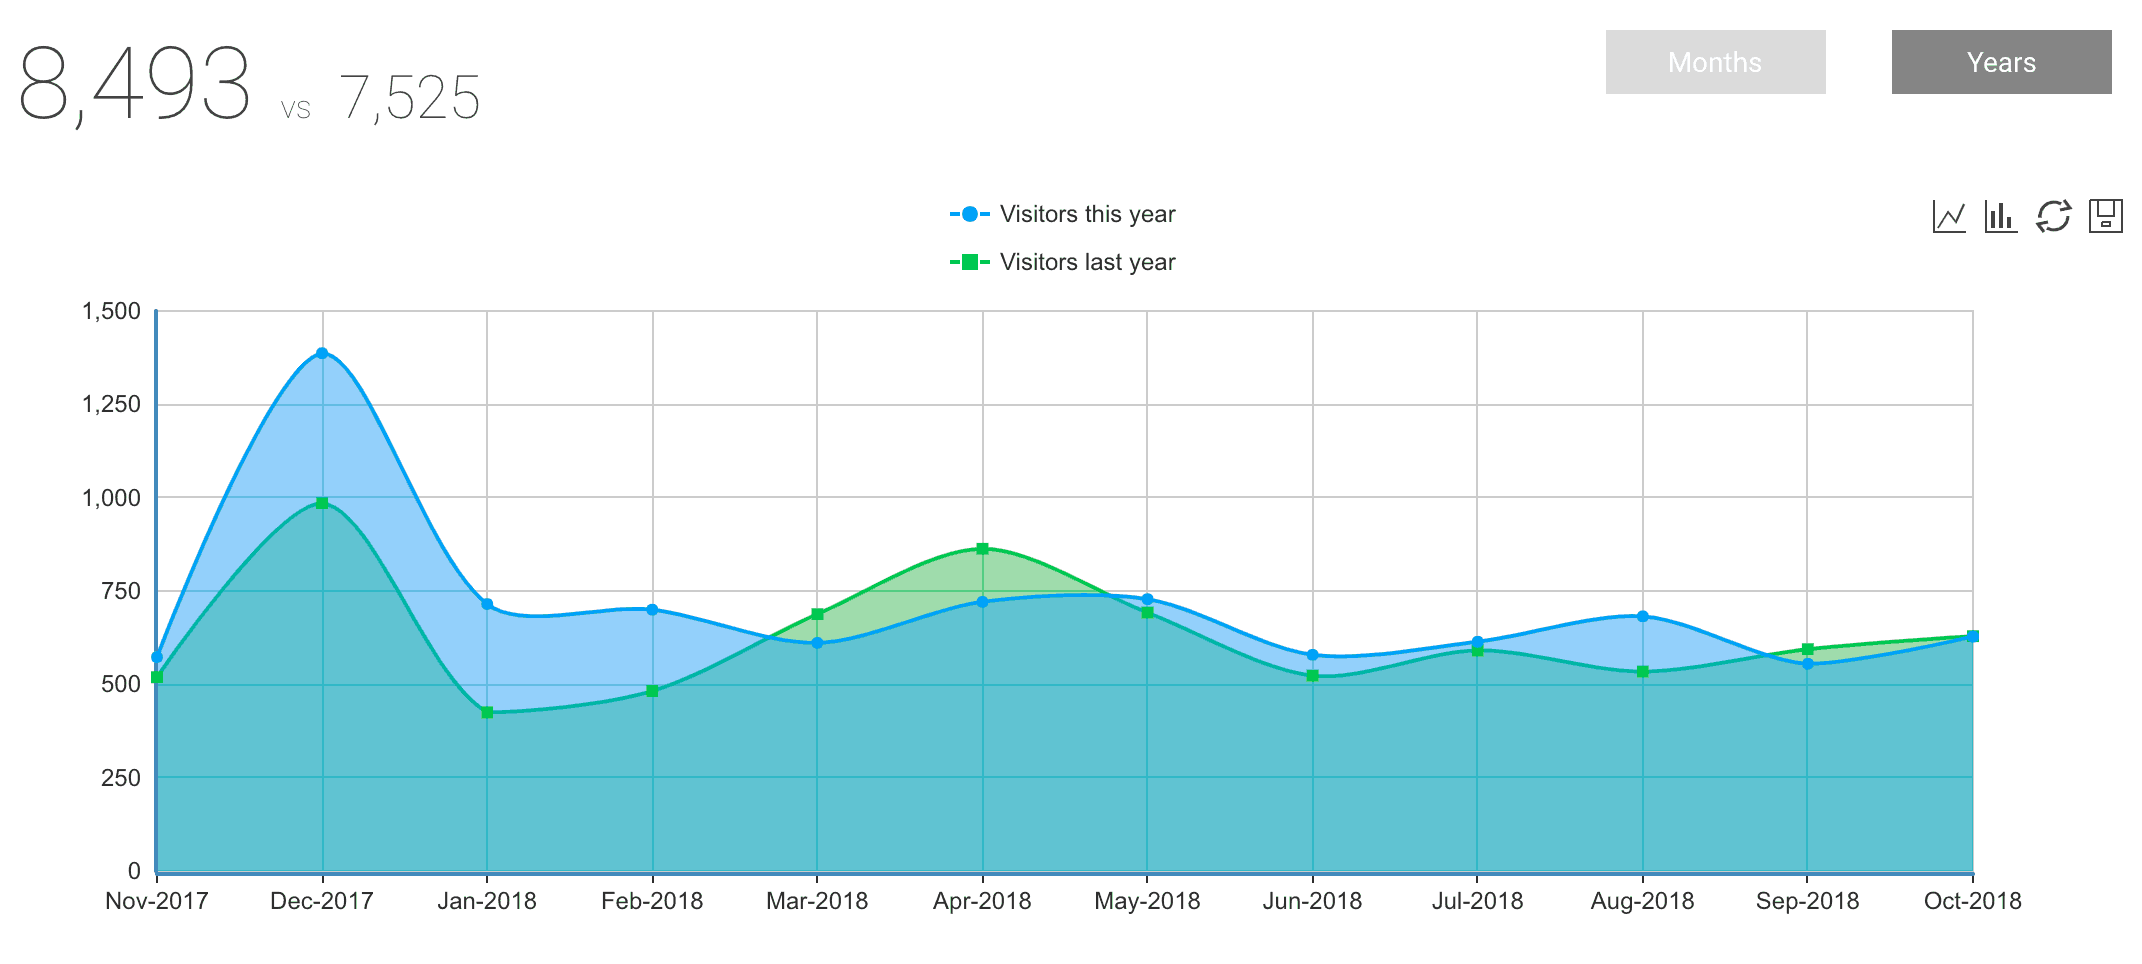
One of the first things you want to look at is your traffic. You can measure your website traffic either in terms of visitors or actual people coming into your site, or in terms of the number of views your website is getting. Those are slightly different ways of measuring traffic (Click on image to enlarge).

“Visitors” refers to people, while “views” refers to behavior. One person (visitor) might view your website over and over and increase your views, so these numbers won’t be equivalent, but they should not be that different, either.
The idea is to compare your traffic with the previous time period. Ideally, you want your traffic numbers to be going up steadily because that’s the way content works. It tends to snowball. The more people discover your site, the more discoverable it becomes, so your traffic should be going up.
(But as you can see from my data, that's not the case with my site. It's actually pretty flat, which goes to show how much I've been neglecting my website.)
It’s pretty interesting when you see a spike in traffic. There's always a spike on my site at the end of the year, and the spike was a lot higher this past December 2017 than it was in December 2016. There's a reason for that and Google Analytics is, in fact, part of that reason. Keep reading because I'm going to explain how this happened later on now.
When there's a spike in your traffic, think back and figure out what caused it. See what happened.
When you see a spike in your website traffic, think back and figure out what caused it. It's a sign that something went right!
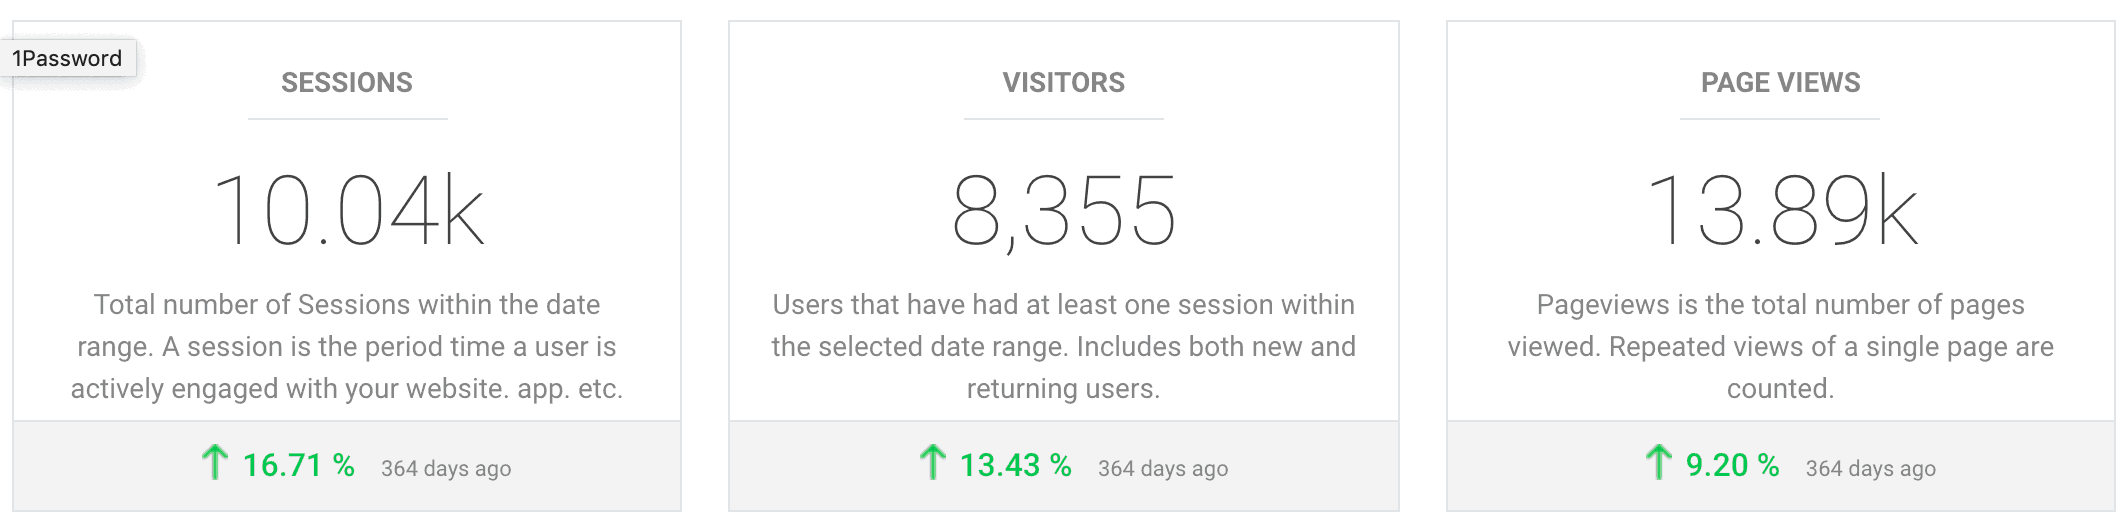
Moving down, you can see Sessions, Visitors, and Pageviews. These are all different ways of measuring your traffic or your audience reach (Click image to enlarge):

A session is when somebody is on your website. It's one visit to your site.
Visitors, as I've mentioned, are people, so these are actual people who are going to your website (hopefully not bots), and these are unique visitors. So if somebody comes to my website five times a week, that will count as five sessions but just one unique visitor.
Pageviews is the number of pages that visitors look at, on average, while they're on your my website. Page view is more about how much content your web visitors are consuming.
As you can see, compared to the previous year, this past year has been good. I had an increase across the board in terms of my traffic and audience reach. There are more sessions or times that my website is being visited. There are more people visiting my site. And the page views has also increased.
Now let's look at other numbers from Google Analytics.
Engagement Metrics
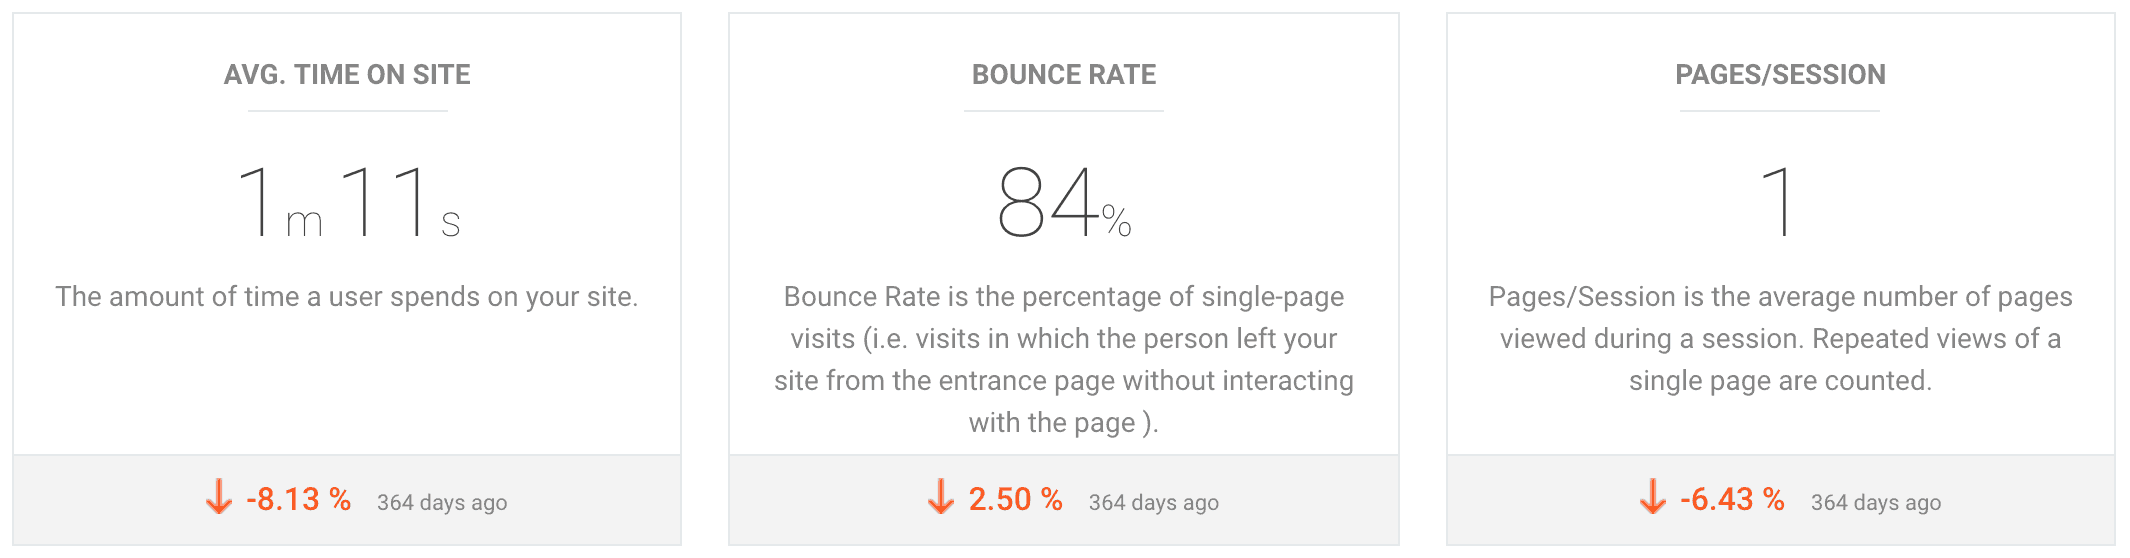
These metrics have more to do with engagement (click to enlarge):

Average time on site refers to how long people are staying on your website.
Bounce rate means what percentage of your website visitors are bouncing out of your site or leaving your website after just looking at a single page on your site.
Pages per session refers to the number of pages they are reading when they go to your site.
These are engagement numbers. For average time on site, the higher the number, the better. For bounce rate, it's the opposite: the higher the number, the lower the engagement is. And in terms of pages per session, again, we want this number to go higher.
As you can see, my engagement numbers are all down. Average time on site went down. My bounce rate went up, which is not a good thing. Pages per session also went down.
In other words, people are sticking to my site less. They're spending less time on my site and they're looking at only one page per session, on average.
This is not necessarily a bad thing. It really depends on what your goal is for your site.
For example, if I'm doing a lot of affiliate marketing on my site, that would explain why my bounce rate is high. That’s because I want them to click on my affiliate links and buy the product I'm promoting, which is not on my website. When they click on my link to check out or buy a product I'm promoting, they’re directed away from my website .
That might explain why my bounce rate is high.
But if the primary goal of my website or page is to get people to hire me or to purchase my product, then it depends how the website is set up.
High bounce rates are not necessarily a bad thing. It depends on what the goal of your website or page is.
If you're an e-commerce site, then you want the bounce rate to be low because you're doing the actual selling on your site.
But if, like me, I have PayPal buttons so when visitors click on the PayPal button, that will lead them outside of my site. Again, that might explain why my bounce rate is high.
Another example, for my coaching services, clients have to pay for it on my booking page, which is outside my website. That could explain the high bounce rate. You can drill down and figure out if this is, in fact, the case.
These numbers are good indicators to look at.
I might want to keep my website visitors longer on my site and encourage them to read more pages, just to nurture the relationship.
Let's look at some other numbers we have at our disposal.
Audience Demographics/Characteristics
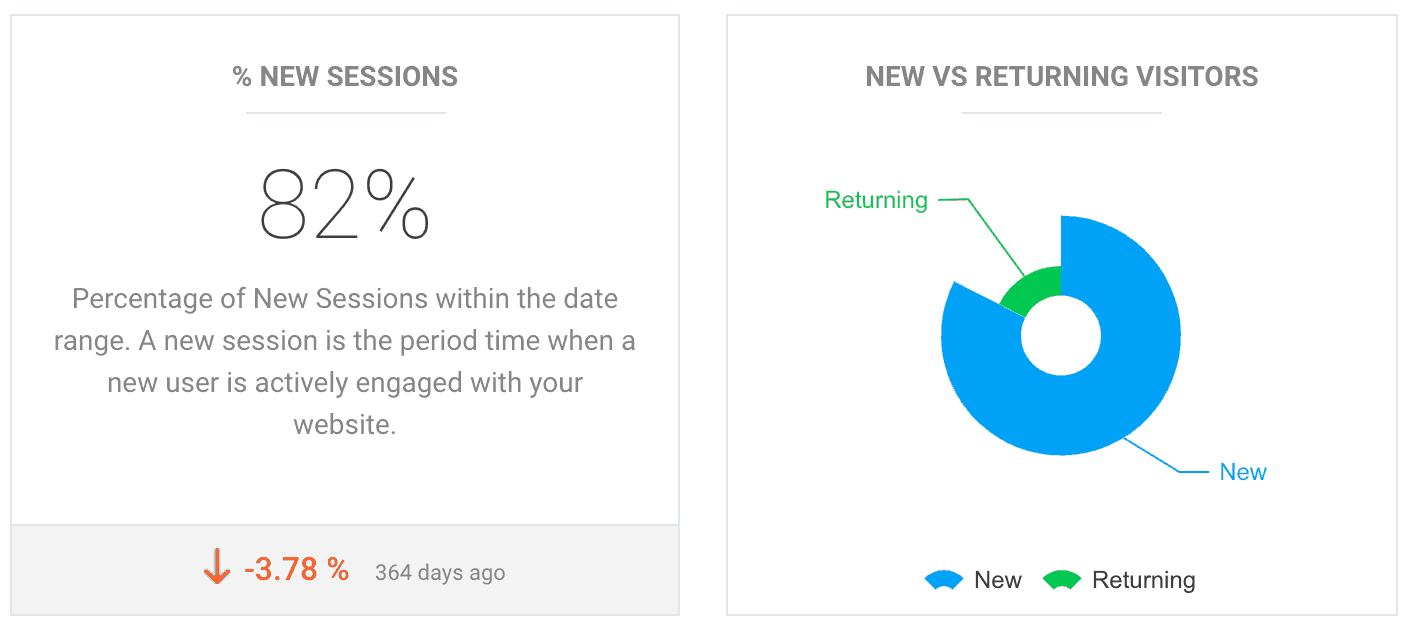
New vs Returning Visitors

The percentage of new sessions on my site is 82 percent. This means that these are people who are new to my site; they've never been to my site before. And that's a majority of my visitors.
A very large percentage of my website visitors are new. What does this mean?
First of all, I should probably be emailing my subscribers more when I have new content on my site to get them back to the site or tell them more about the products and services I'm promoting either as an affiliate or my own products and services.
This is also telling me that I'm probably not doing a good job of nurturing relationships with my subscribers and that's why they're not returning to my website.
It's also telling me I should probably be thinking about what to do with my new visitors. It's great that I’m getting a lot of new visitors to my site, but it's my site optimized to, first of all, keep them on the site longer?
With new website visitors, you want to increase the pages per session because people are not likely to buy from you the first time they're learning about you. And so, you want to nurture that relationship. Part of nurturing that relationship is encouraging and inspiring them to consume more of your content.
I'm going to want to increase the pages per session and the average time on site and reduce the bounce rate, just to make sure I’m building a relationship with all these new people who are discovering me for the first time.
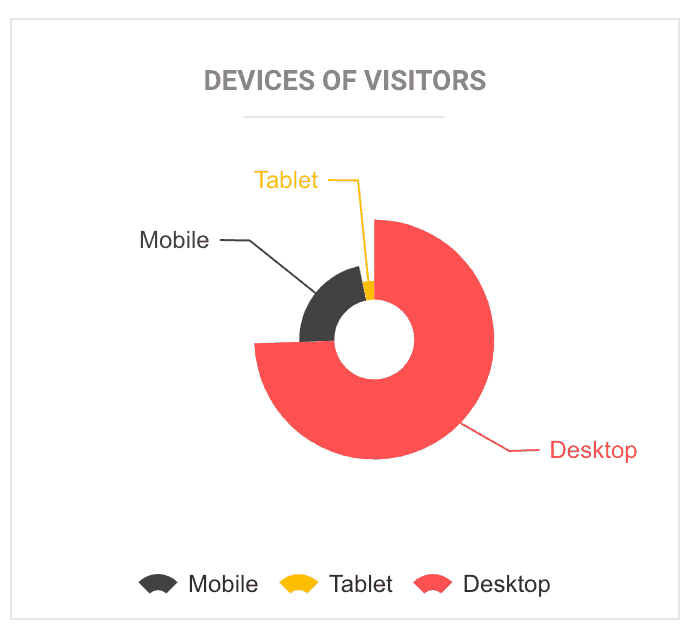
Devices

Let's look at some other information we have. In terms of devices of visitors to my site, I can see that most of them are still on desktop. Just about 22% are using mobile devices (these are probably referring to smartphones). And a very very small percentage is using tablets.
This has implications on how your website displays on various devices. My site is on a theme that optimizes my pages and posts for any device. I can actually preview what it looks like on a smartphone, on a tablet, and on a desktop.
When I make these online videos, I have a choice of whether my videos are going to be horizontal like you're probably watching now on this post, or if I should make them square which is optimized for cell phones. Since the majority of my visitors are on desktops or laptops, I'm probably good sticking to this horizontal format for my videos.
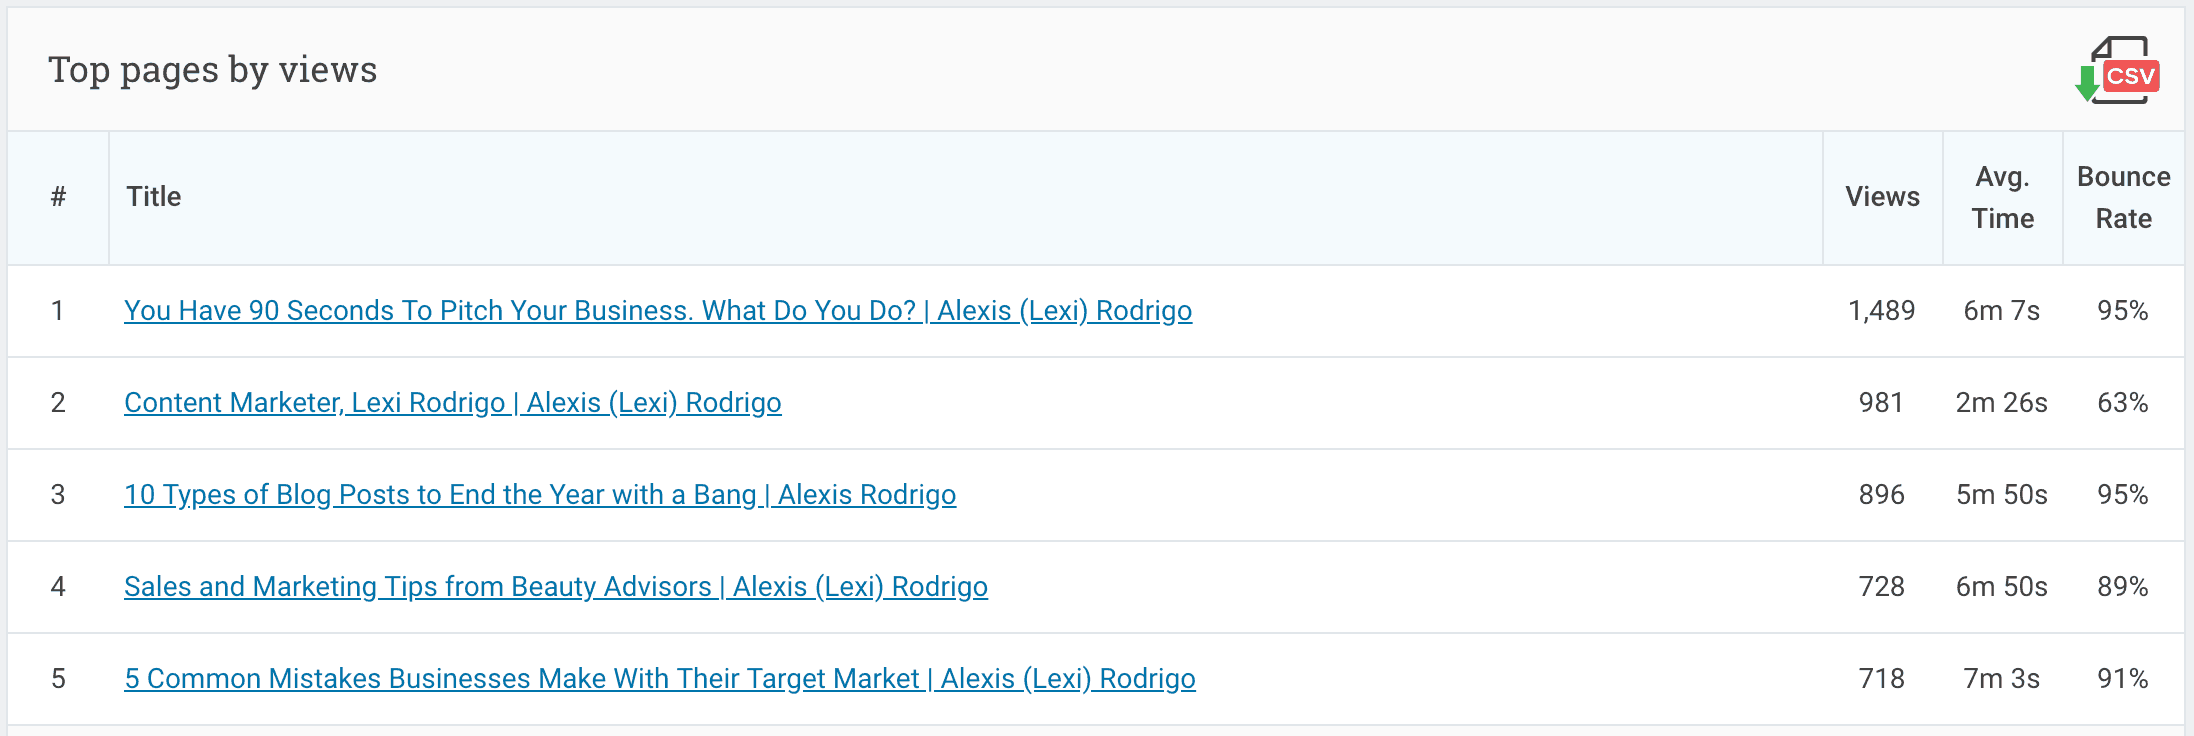
Content Consumption

Another very useful thing to see is what your most popular pages and posts are by looking at top pages by views. If you're a blogger, you’ll want to find out what your most popular blog posts are.
I can see that these are my top five pages and blog posts. In fact, in second place is my home page, which is unusual. Usually the home page is the most popular page, but in the case of my site, it's a blog post.
This means these posts are probably getting organic traffic because these are not the pages people would find if they were Googling me, "Lexi Rodrigo," or "Alexis Rodrigo."
Let's look at this top post entitle, “You Have 90 Seconds to Pitch Your Business, What Do You Do?”
People tend to read this post—which is good—but there's a very high bounce rate: 95% of them leave the post when they're done reading. I have to figure out why is. They're staying for a long time, they're actually reading the post, which means that this is actually a useful post for them.
But I'm not offering them a way to go forward within my site but I give them what they need and then that's it. They're satisfied and they leave. I should do something about that. I can go back and make a decision to update this post. This is quite an old post and updating it would probably make it rank even higher in the search engines and get even more traffic.
And I should do something with this post to encourage readers to click through to other pages on my website or just click through to other blog posts.
What is this is telling me? It’s telling me that if I have newer blog posts that I really, really want to drive traffic to, it makes sense for me to link to the new blog post from these top-performing posts. That's another way you can use this information.
Another thing is, if you see that a blog post is performing well and it's kind of old, then you might want to up update it.
Updating means you edit the blog post, add new stuff, embed a video, create more graphics or an infographic, and format it better. Update the content of post with new data and then just publish it. This actually makes the search engines give it even more search love.
That's what I did with a post in December last year and, if you notice, there was a spike in my traffic. By chance, I took a peek at my Google Analytics and I saw that massive spike. When I dug into the data, I saw that the spike was due to this year-end post, so I went in the post, updated it, and published it.
When I looked at that post, I found out that was even referring to the year being 2009 or 2010, so I updated it to make it timeless. I did not refer to any specific year anymore because I realized people were coming back year after year to this post. I made it more of a timeless post so that people who read the post five years from now, it would still be relevant to them. I also optimized that post for conversion.
When you have a high-performing post you want to make sure there are several ways in that post for people to subscribe to your mailing list or even to buy your product.
These are good posts because people are staying 5 to 7 minutes. People are actually staying to read the post. But, as you can see, the bounce rates are quite high, so I want to do something about that. I’d want to have links in these posts to other posts within my blog.
That's how you get the bounce rate to go down.
As you can see, the bounce rate on my home page is lower, 63 percent, which makes sense. The home page has general information and it's all about links to other parts of my website. It links to my services page and my blog posts.
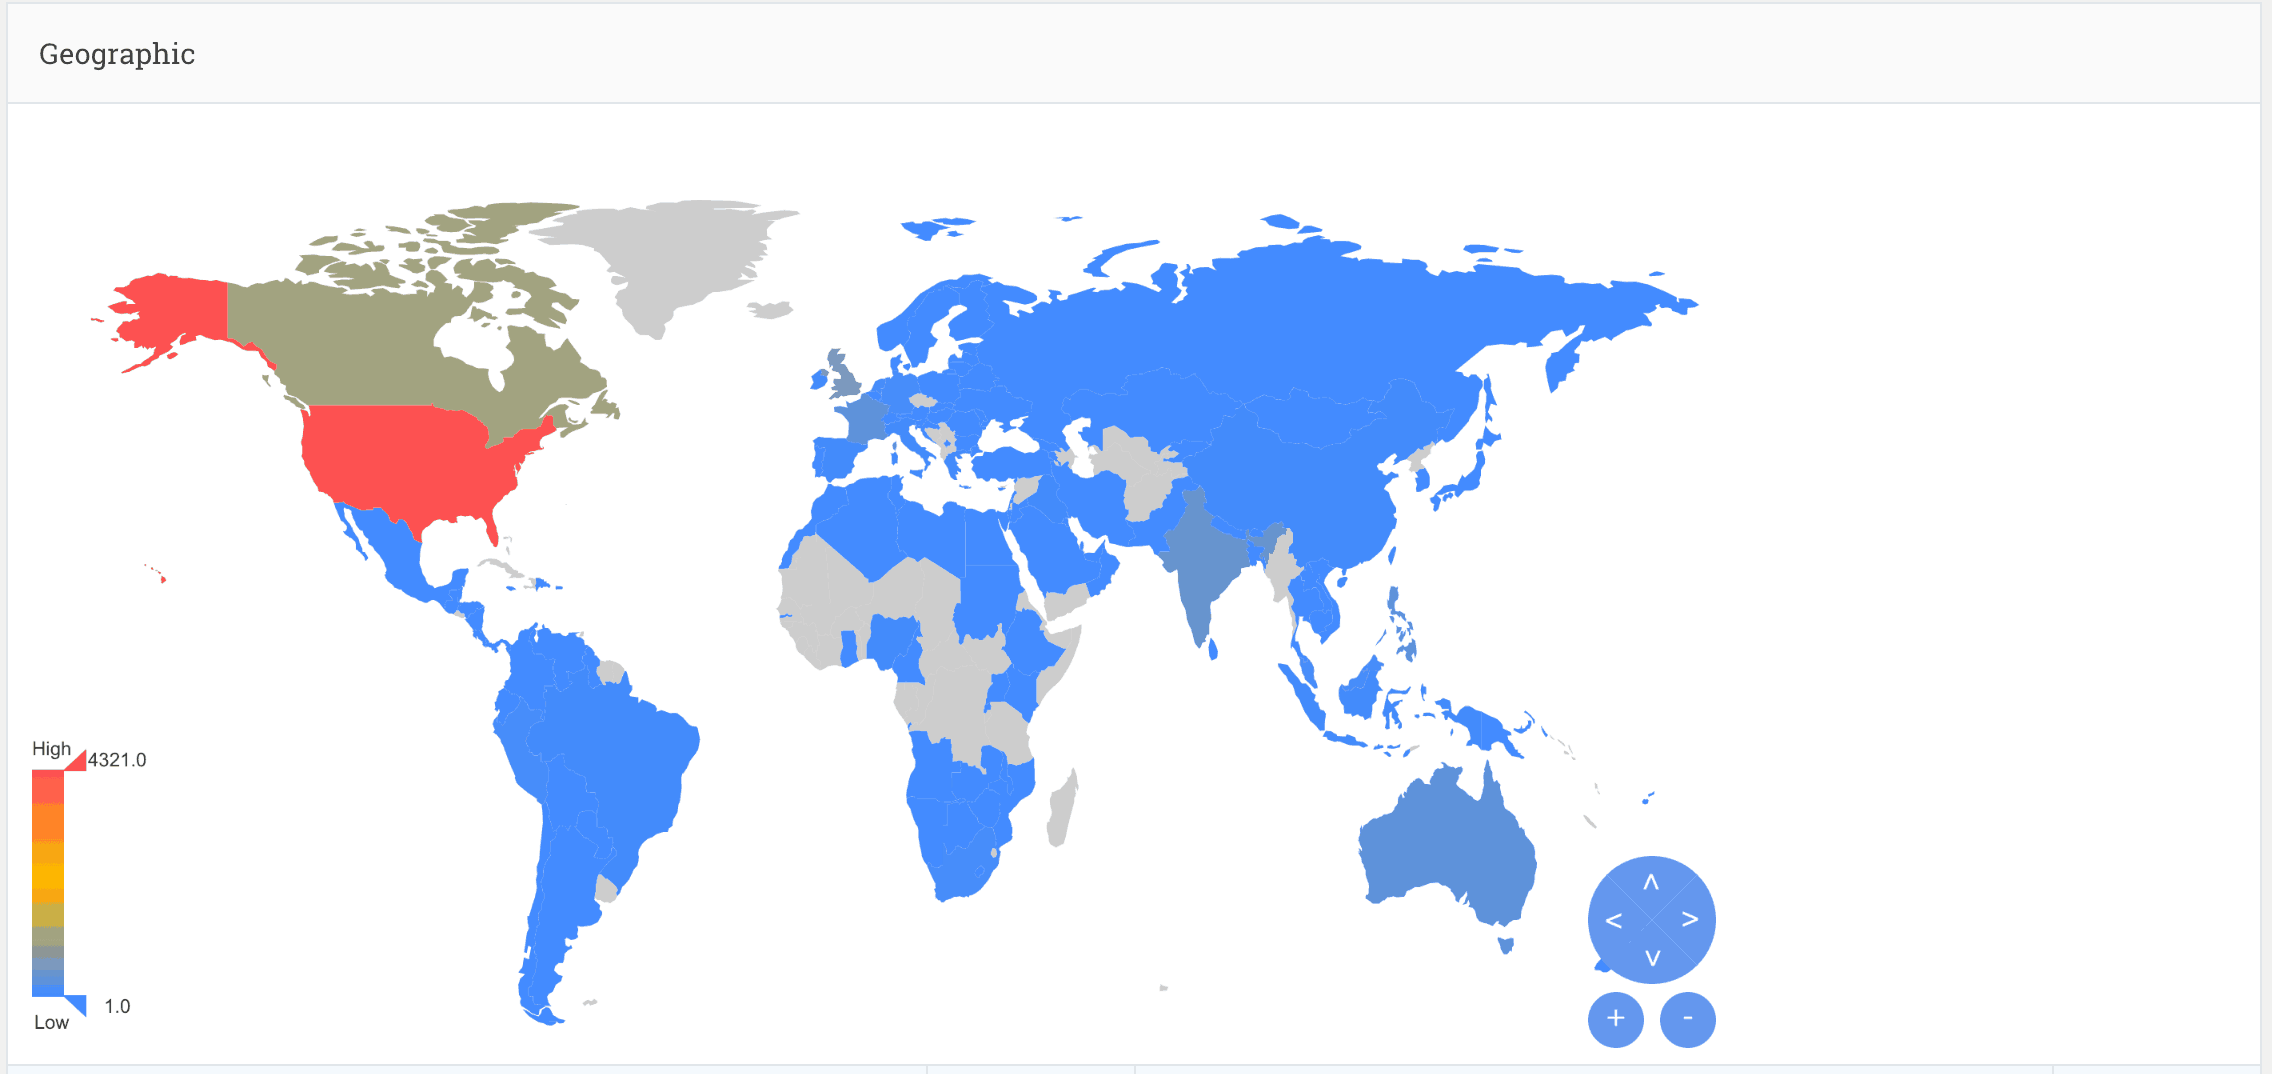
Geographic Data


The geographic data is telling me where most of my visitors are. The red parts show that the majority of my visitors are from the United States, followed by Canada and a little bit of India.
So when I'm writing my blog posts, I'm going to stick to American English rather than Canadian English or even British English (which I'm used to because I used to work in the United Nations). Because most of my readers are in the US, I will stick to American English.
You can drill down through to the top cities. My home city is on top, so thank you, neighbors and friends, for visiting my website.
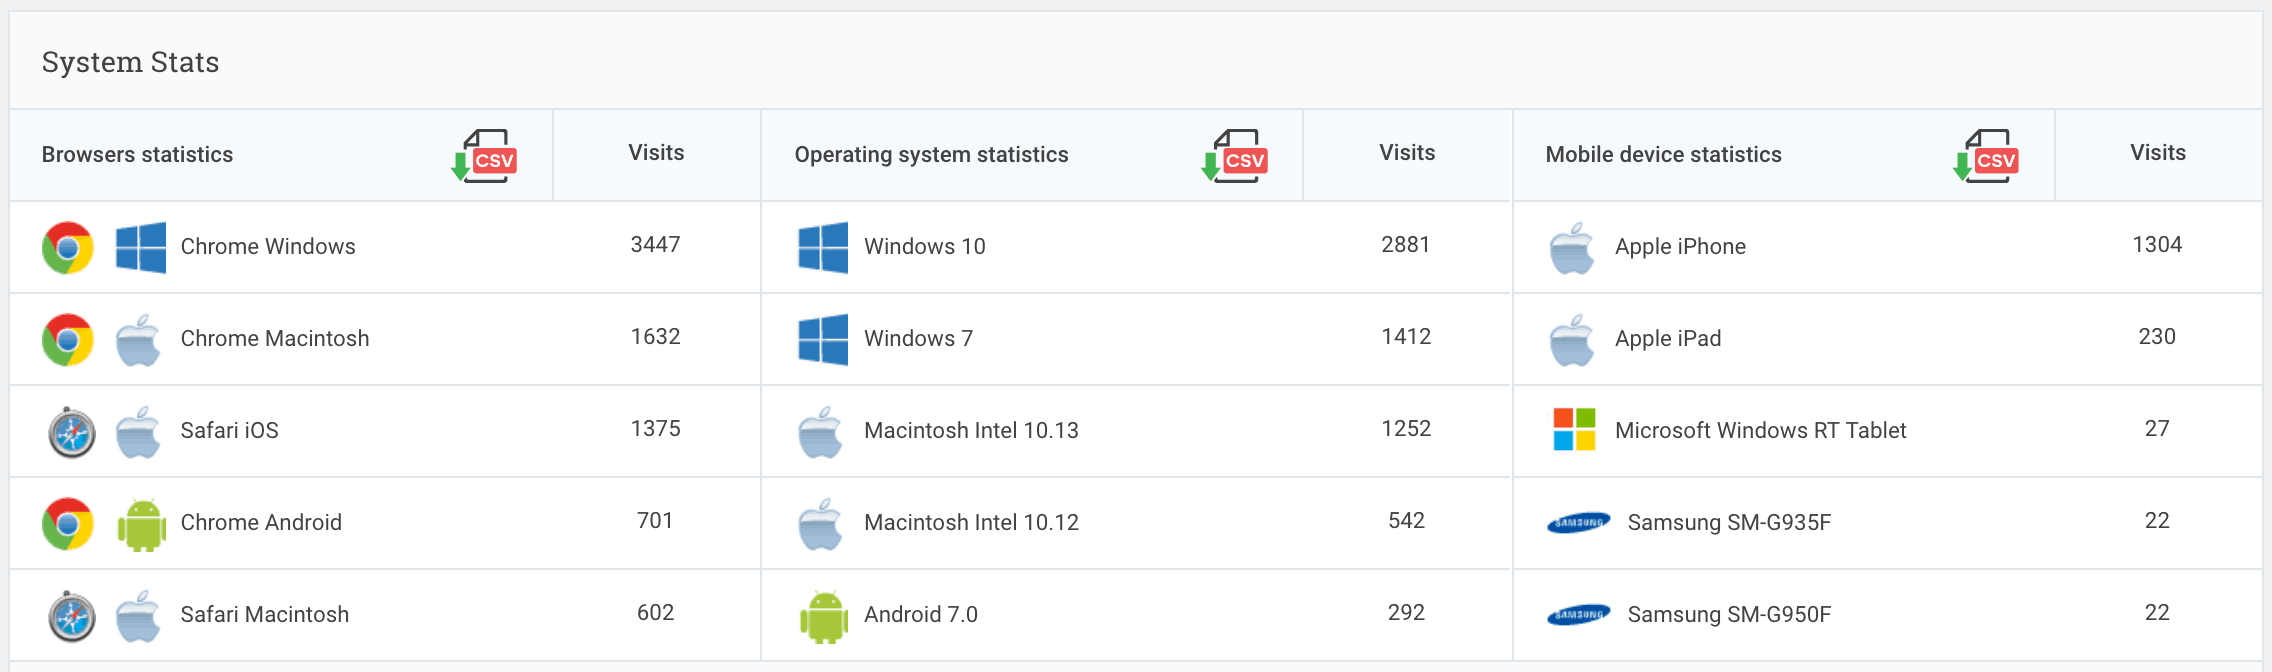
System Statistics from Google Analytics

What operating systems, browsers, and devices do my website visitors use?
I see that most of you are on Windows and Chrome. Again, this is important to know so you can make sure your site displays and works properly on these platforms. You can test what your site looks like on different browsers and operating systems.
Traffic Sources
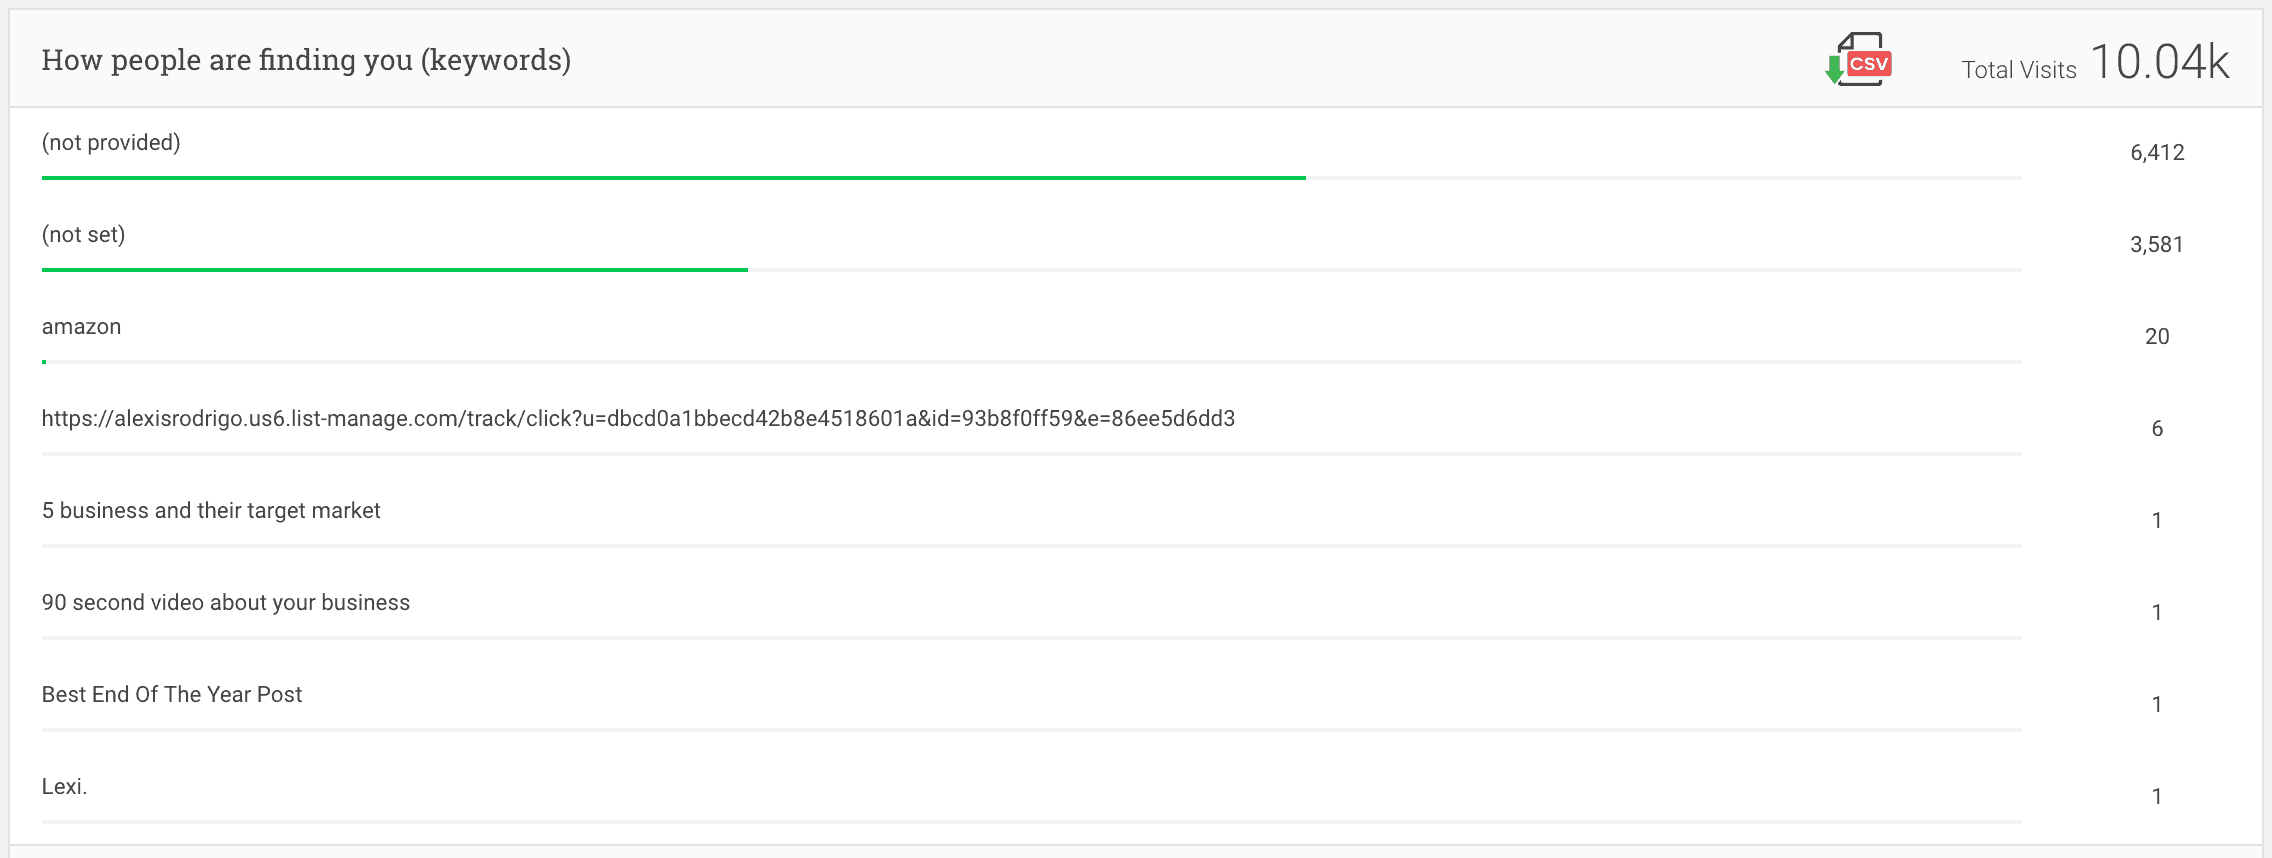
Keywords
This section tells you the keywords people are using to discover your website. This is where Google Analytics often fails because a lot of the time it will say “not provided” or “not set,” which are not helpful at all (click image to enlarge).

It'll probably help for me to go into the Google Search Console, which is another Google product and it's also free. I don't know why it needs to be separate and I won’t be able to do it from my Website.
The rest of these keywords are not helpful at all.
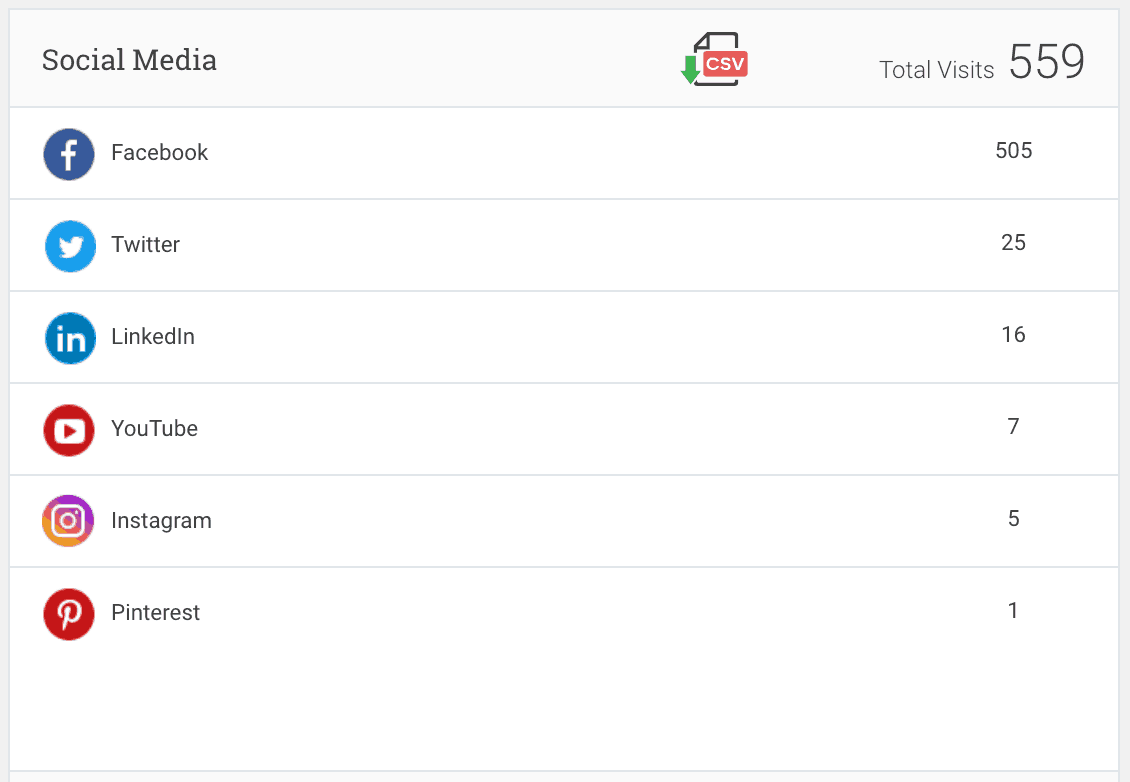
Traffic from Social Media and Other Referrals
In this section, I can see that Facebook is really my biggest driver for traffic so I might want to focus on Facebook and and promote my stuff more on Facebook (click to enlarge image):

Incidentally, if you're not connected with me yet on Facebook, you can do so here 😉
When you're looking at these numbers and you see something working, you want to double down on that. That's how you use your Google Analytics data. Double down on what's already working.
In contrast, I can see that Pinterest sent almost no traffic at all. That makes sense since I'm not doing anything on Pinterest.
But if, for example, I had been spending most of my time on Instagram and then I see that it's actually not getting a lot of results, then I will spend less time on Instagram and more time on Facebook.That's the logical way and that's how you get smart with this data.
Now here’s an interesting thing: I actually a number of pop link referrals and I haven't been using pop link at all lately. After seeing this number, I might want to go back and use it again because it seems to be working well.
Why haven't I been using it? I don't know, maybe because I hadn't seen this data before today!
Look at your social media referral traffic so you know which platforms to focus your time and energy on.
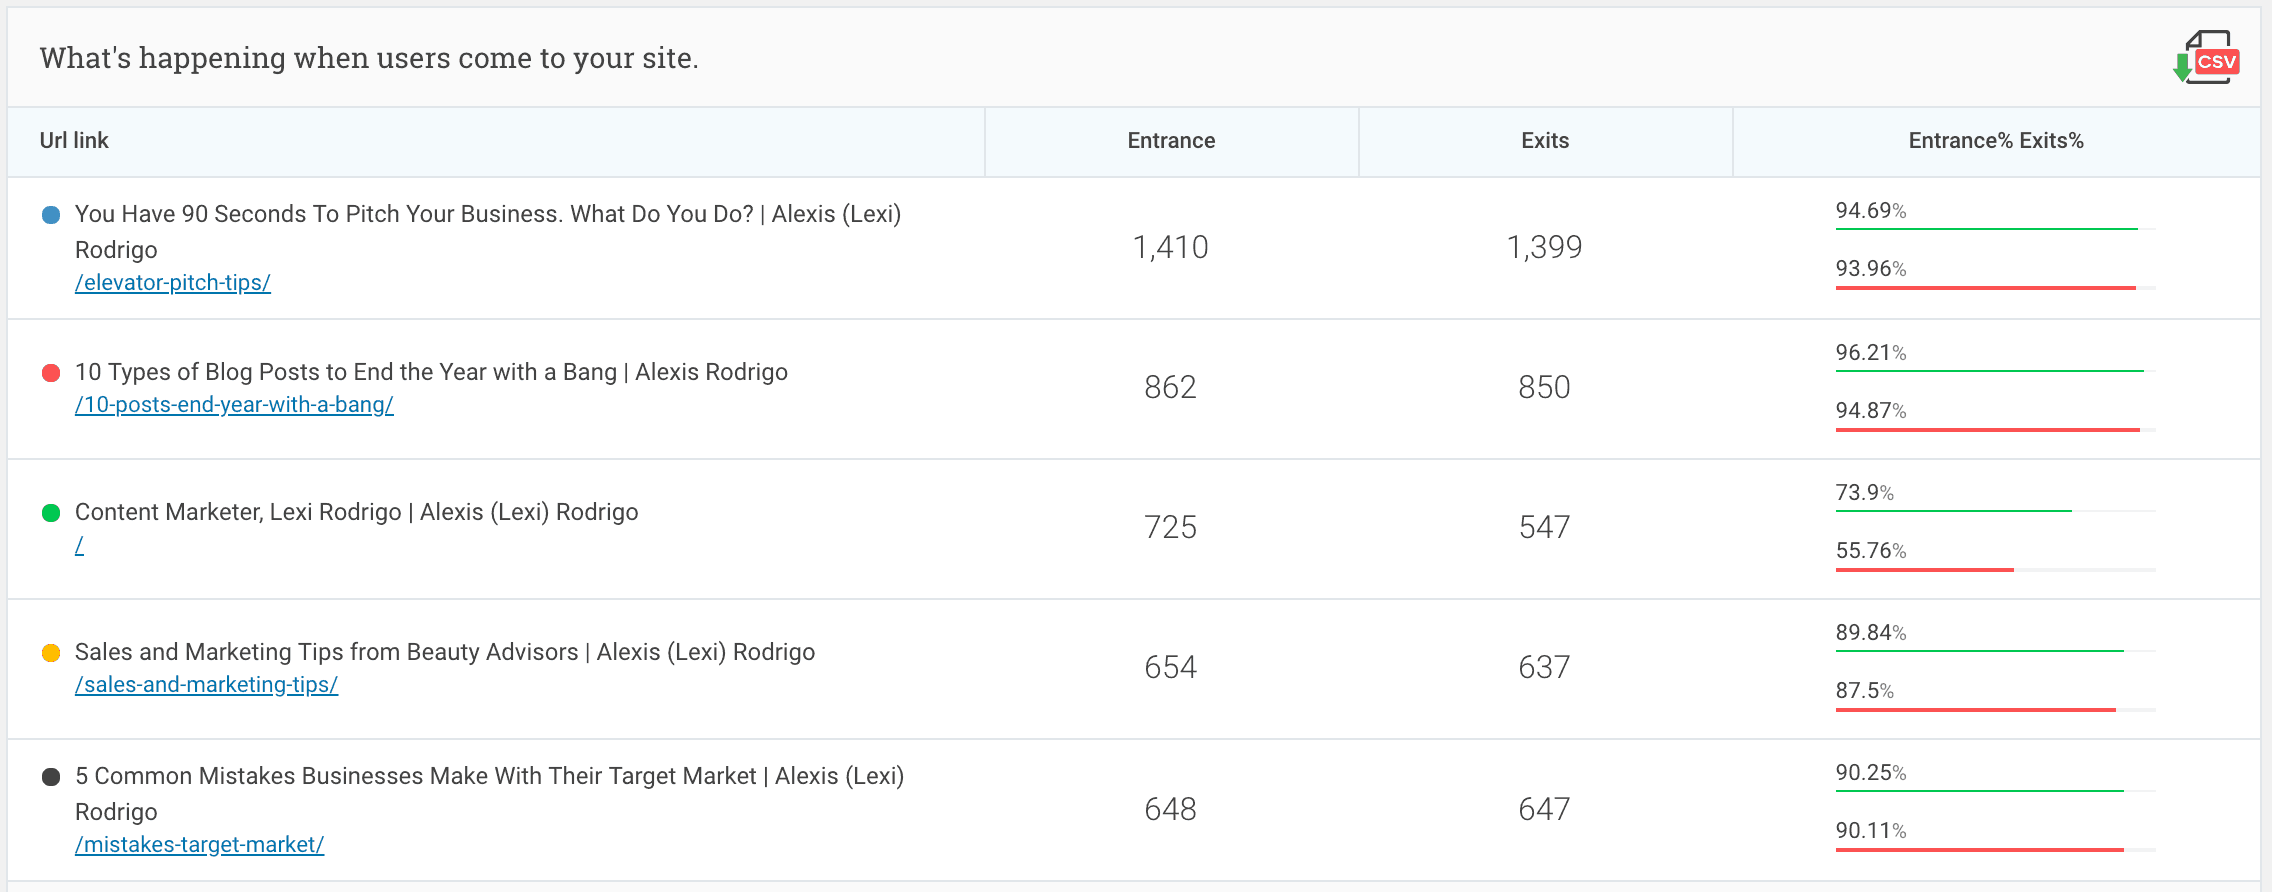
Website Visitor Behavior
You can keep looking at what's happening with your users when when they go to each page (click to enlarge the image):

This tells me the same thing: I need to keep my website visitors on my site longer.
Let me show you one more thing....
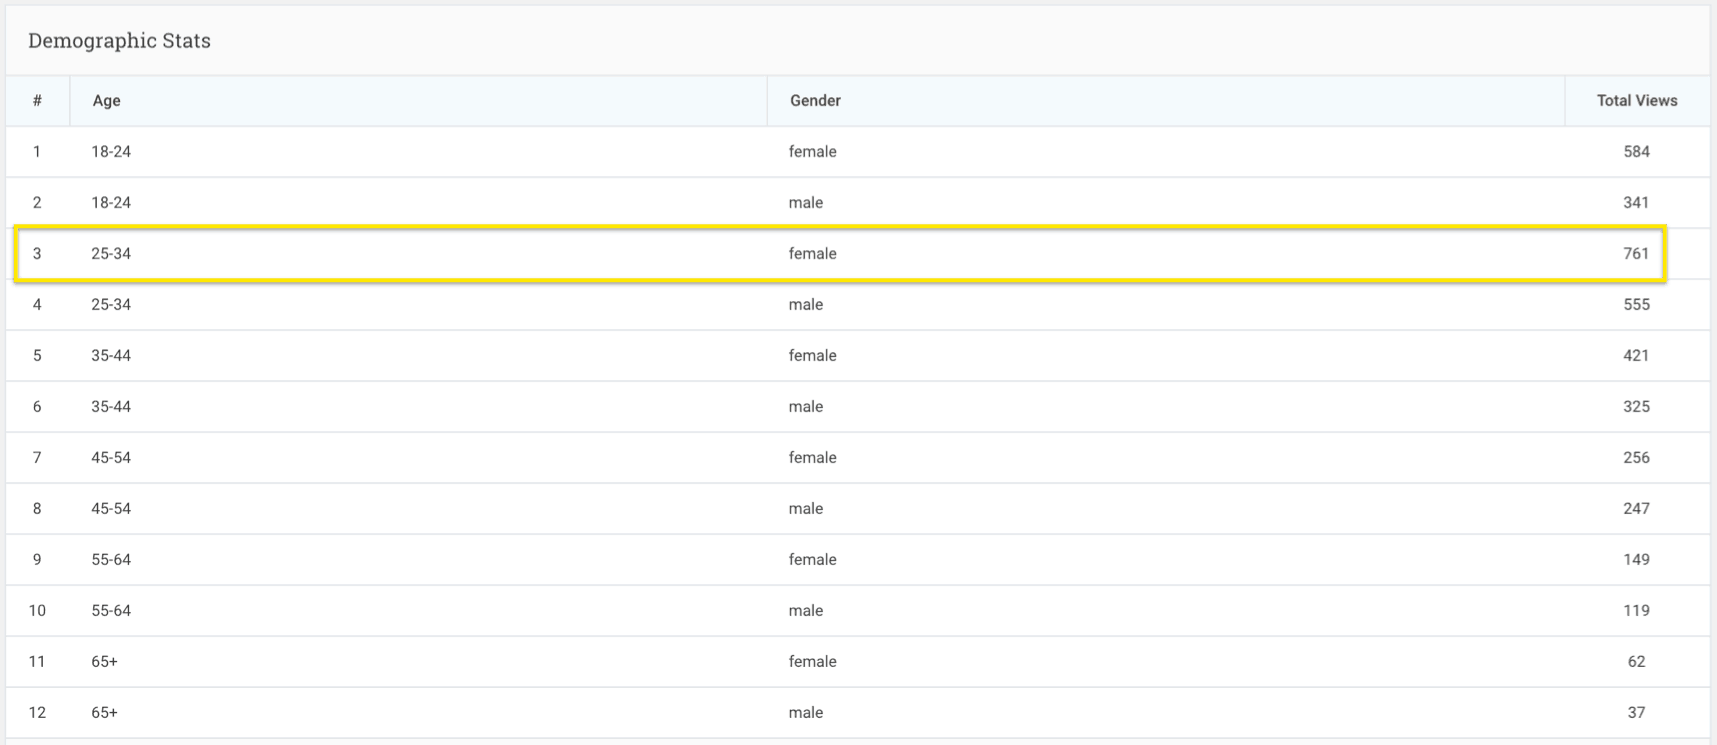
Demographics Dashboard
This demographics dashboard shows me the age and the gender of my website visitors. I just wish that they would sort this right or show me the data as graphs (click to enlarge the image):

I can see that most of my visitors are female and between 25 to 34 years of age. So my audience is skewed heavily towards females and most of them are 25 to 34 or younger.
I’m going to keep this in mind when I'm thinking of my content topics, the language, and even the images and colors I use.
Those are all the things that can be informed by Google Analytics data.
Google Analytics data on the demographics of your website visitors will inform decisions about the topics, language, images, and even the colors you use.
Analytify Makes Google Analytics More Accessible
If you like what you’re seeing, it’s a plug-in called and Analytify, which collects all your Google Analytics data and puts them in your your WordPress dashboard in a way that's really easy for you to understand.
You don't have to feel like an idiot. You don't have to feel like you're finding your way through a labyrinth. As you saw, it was quite easy on the eyes, very nice to look at, and it shows you a lot of other information.
Are you a Google Analytics beginner? How do you use your website’s Google Analytics data? Or have you been avoiding even logging into your account? Share your experience in the comments!
PS: If you want a Google Analytics data without leaving your WordPress dashboard, like you see in this post, then use the Analytify plugin.